A portfolio tracker UI designed from first principles
FINARKY's UI is designed from first principles to be simpler and more powerful than typical portfolio trackers.
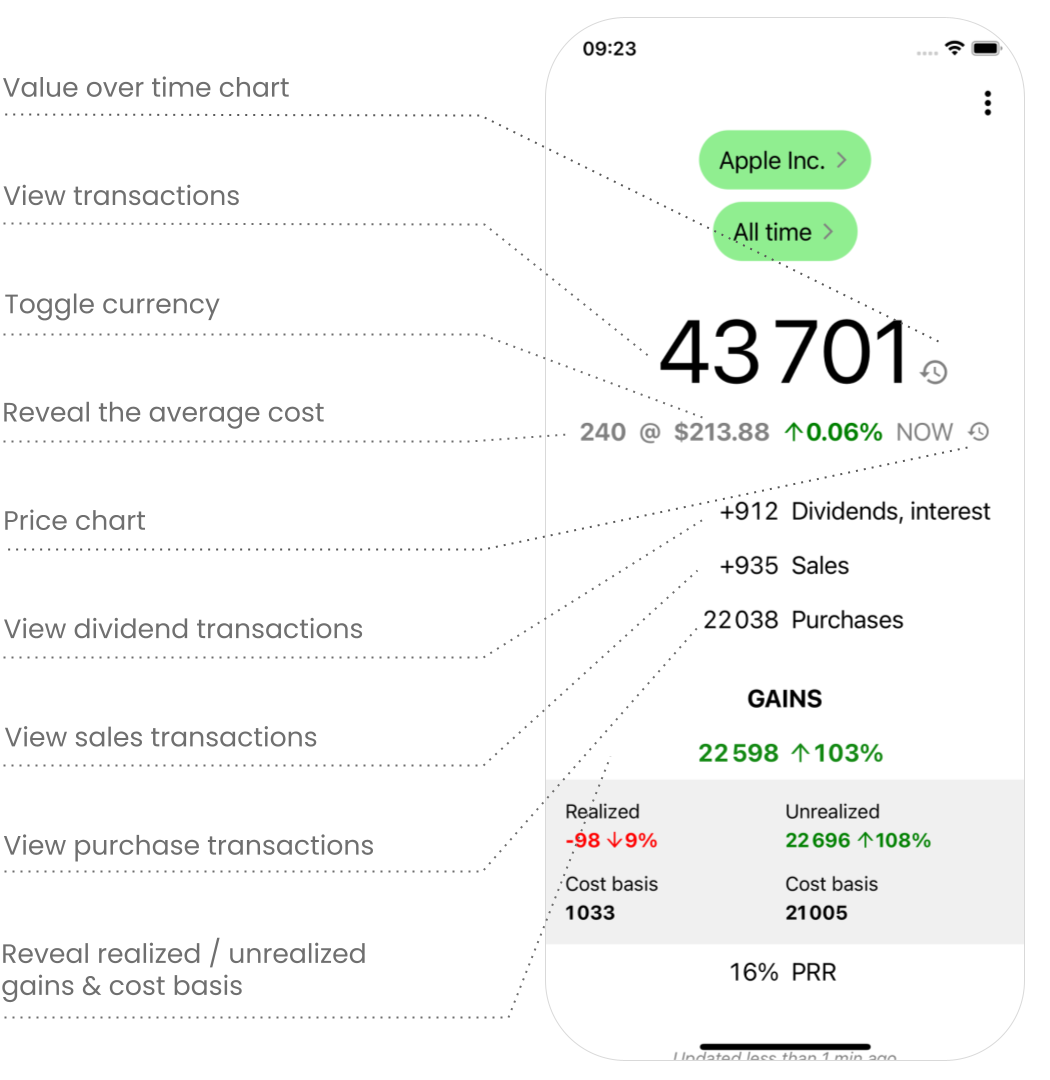
It uses assets and time periods as a contextual lens for everything. All metrics (value, PRR, gains...) are filtered through that context. This keeps the interface consistent and predictable, so it's easy to navigate and explore a portfolio without feeling overwhelmed or lost.
And everything is just one tap away...